Methods for and results from profiling OTrunk.
JIP
See: Java Profiling with JIP for instructions for setting up JIP and using it with Eclipse.
Profiling by thread and call tree
I profiled the OTrunk LOOPS demo activity: motion-graph-multi-activity1 using JIP.
JIP collected data on all the threads (screen captures from jipViewer):
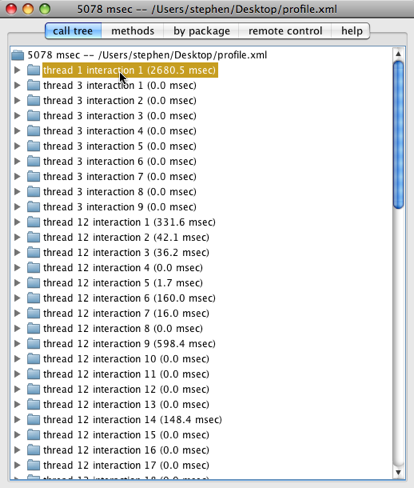
Here's a partial display of the call tree for thread 1:
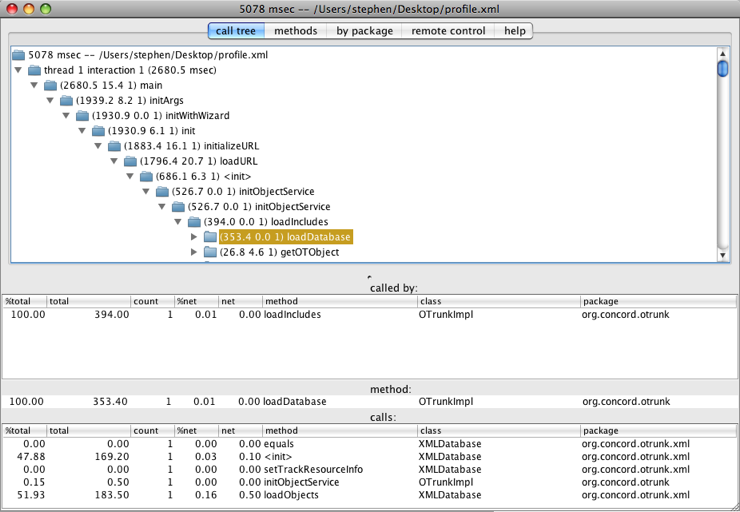
Executing Main in thread 1 takes almost 2.7s and 0.35s of that was spent in loadData.
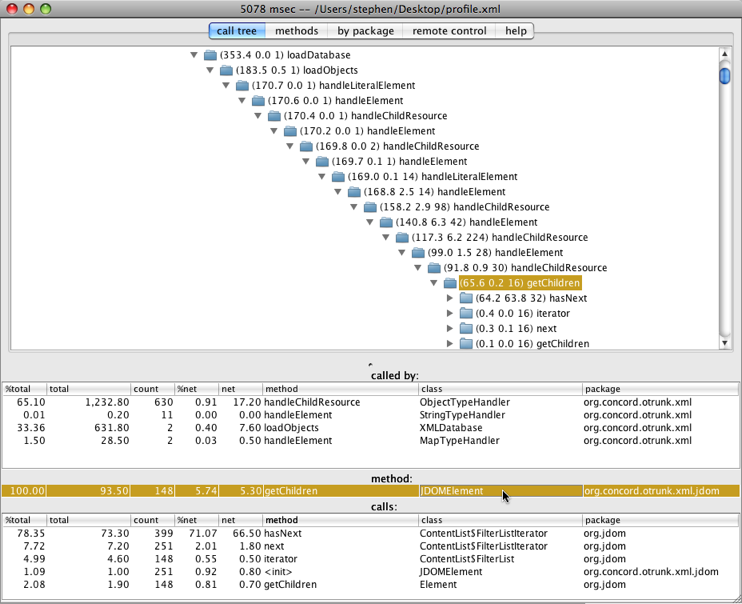
Taking a closer look at why loadData was taking so much time you can see that a portion is spent in jdoms getChildren method:
Adding method signatures
I added this parameter to my profile.properties file:
output-method-signatures=yes
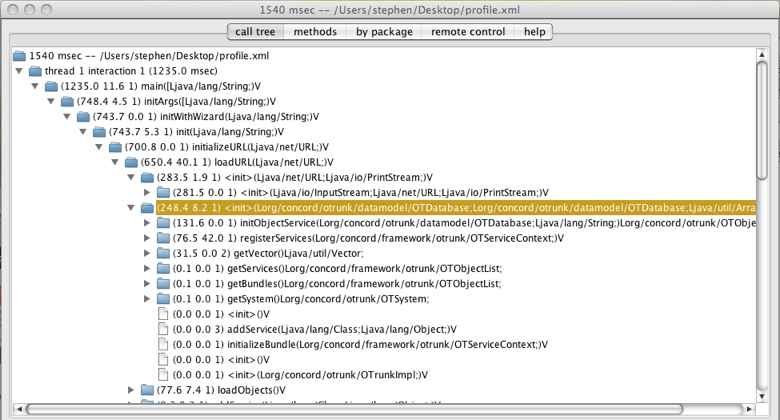
and created a profile for one of the simplest OTrunk activities: Basic Text Edit. The result below shows how now the two calls to <init> by loadURL can now be distinguished by their method signatures (and also that this simple activity starts up in about 1/2 the time of the more complex activity):
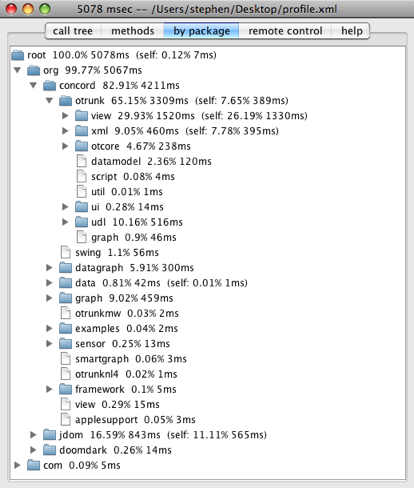
Viewing profile results by package
You can see in the display below that during the course of the OTrunk activity almost 17% was spent in jdom while 30% was spent in the view package.
Profiling a Timeline
JIP alternatively supports collecting a timeline of actions. Timeline profiling only outputs in a text file format and is not viewable using JipViewer. The timeline data shows events from different threads in sequence.
Here's a short excerpt showing one thread ending and another starting near the 2s mark:
Time: 1939 ms.
	START	[1]	SimpleTreeModel:isLeaf	(org.concord.view)
	START	[1]	OTFolderNode:getChildCount	(org.concord.otrunk.view)
	END	[1]	OTFolderNode:getChildCount	(org.concord.otrunk.view)
	END	[1]	SimpleTreeModel:isLeaf	(org.concord.view)
	START	[1]	OTFolderNode:toString	(org.concord.otrunk.view)
	START	[1]	$Proxy11:getName	()
	START	[1]	OTBasicObjectHandler:invoke	(org.concord.otrunk)
	START	[1]	OTInvocationHandler:invoke	(org.concord.otrunk)
	START	[1]	OTObjectInternal:getName	(org.concord.otrunk)
	START	[1]	OTObjectInternal:getResourceValue	(org.concord.otrunk)
	START	[1]	XMLDataObject:getResource	(org.concord.otrunk.xml)
	END	[1]	XMLDataObject:getResource	(org.concord.otrunk.xml)
	END	[1]	OTObjectInternal:getResourceValue	(org.concord.otrunk)
	END	[1]	OTObjectInternal:getName	(org.concord.otrunk)
	END	[1]	OTInvocationHandler:invoke	(org.concord.otrunk)
	END	[1]	OTBasicObjectHandler:invoke	(org.concord.otrunk)
	END	[1]	$Proxy11:getName	()
	END	[1]	OTFolderNode:toString	(org.concord.otrunk.view)
Time: 1944 ms.
	START	[12]	OTViewContainerPanel$CreateComponentTask:run	(org.concord.otrunk.view)
	START	[12]	OTViewContainerPanel:createJComponent	(org.concord.otrunk.view)
	START	[12]	OTViewContainerPanel:getOTJComponentService	(org.concord.otrunk.view)
	END	[12]	OTViewContainerPanel:getOTJComponentService	(org.concord.otrunk.view)
	START	[12]	OTViewContainerPanel:getViewMode	(org.concord.otrunk.view)
	END	[12]	OTViewContainerPanel:getViewMode	(org.concord.otrunk.view)
	START	[12]	OTJComponentServiceImpl:getObjectView	(org.concord.otrunk.view)
	START	[12]	OTJComponentServiceImpl:getObjectView	(org.concord.otrunk.view)
	START	[12]	OTViewFactoryImpl:getView	(org.concord.otrunk.view)
	START	[12]	OTViewFactoryImpl:getViewInternal	(org.concord.otrunk.view)
	END	[12]	OTViewFactoryImpl:getViewInternal	(org.concord.otrunk.view)
These data are useful when investigating concurrency issues. The timeline file size for an OTrunk activity start and immediate stop is 22MB. Analyzing this type of data is more practical when collected from a more constrained period of program execution. This can be done with a remote program or programatically inside OTrunk by using JIP classes.
Profile data from several OTrunk startups
The results are attached in these files:
- JIP profile of LOOPS multi-page motion and velocity demo (method signatures turned off): profile_otrunk_20080611.xml (2MB)
- JIP profile of much simpler OTrunk activity: Basic Text Edit (method signatures turned on): profile_otrunk_viewer_basic_text_edit.xml (264kB)
If you have JIP installed you can download these profile and view the results using jipViewer.